Vector Math
This section covers vector math and vector manipulation functions.
Arrays
Arrays can be created with the array function.
For example, the expression below creates a numeric array with three elements:
array(1, 2, 3)
When this expression is sent to the /stream handler it responds with a JSON array:
{
  "result-set": {
    "docs": [
      {
        "return-value": [
          1,
          2,
          3
        ]
      },
      {
        "EOF": true,
        "RESPONSE_TIME": 0
      }
    ]
  }
}
Visualization
The zplot function can be used to visualize vectors using Zeppelin-Solr.
Let’s first see what happens when we visualize the array function as a table.
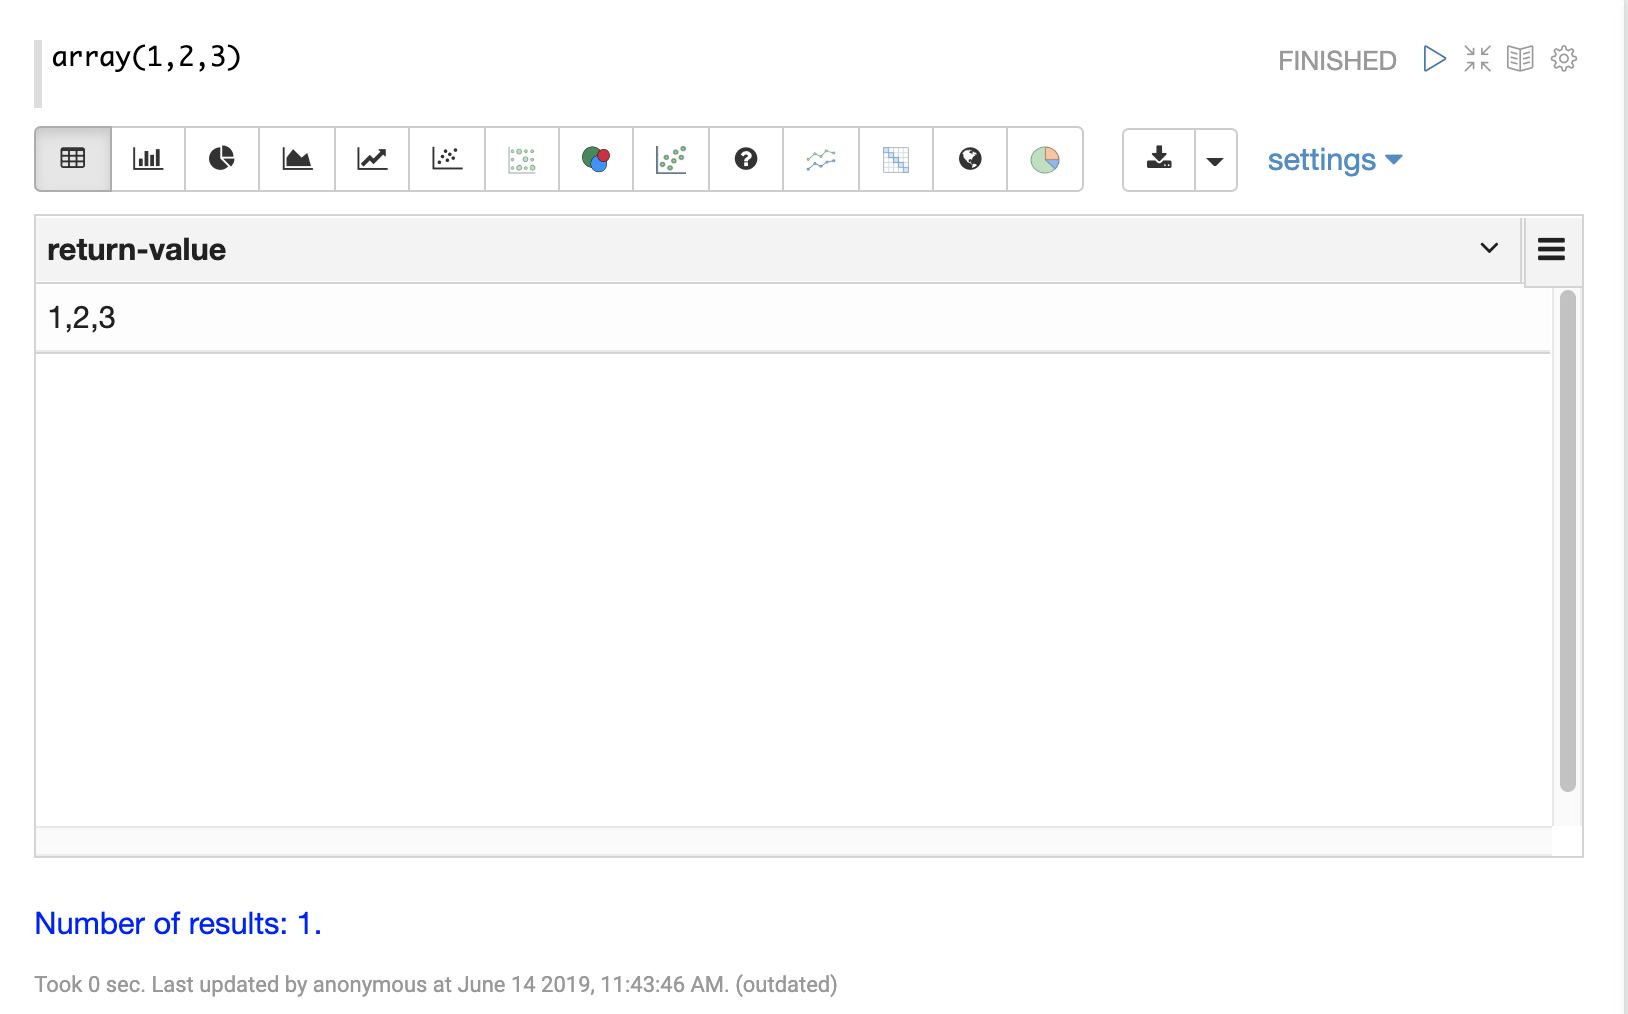
It appears as one row with a comma-delimited list of values. You’ll find that you can’t visualize this output using any of the plotting tools.
To plot the array you need the zplot function. Let’s first look at how zplot output looks like in JSON format.
zplot(x=array(1, 2, 3))
When this expression is sent to the /stream handler it responds with a JSON array:
{
  "result-set": {
    "docs": [
      {
        "x": 1
      },
      {
        "x": 2
      },
      {
        "x": 3
      },
      {
        "EOF": true,
        "RESPONSE_TIME": 0
      }
    ]
  }
}
zplot has turned the array into three tuples with the field x.
Let’s add another array:
zplot(x=array(1, 2, 3), y=array(10, 20, 30))
When this expression is sent to the /stream handler it responds with a JSON array:
{
  "result-set": {
    "docs": [
      {
        "x": 1,
        "y": 10
      },
      {
        "x": 2,
        "y": 20
      },
      {
        "x": 3,
        "y": 30
      },
      {
        "EOF": true,
        "RESPONSE_TIME": 0
      }
    ]
  }
}
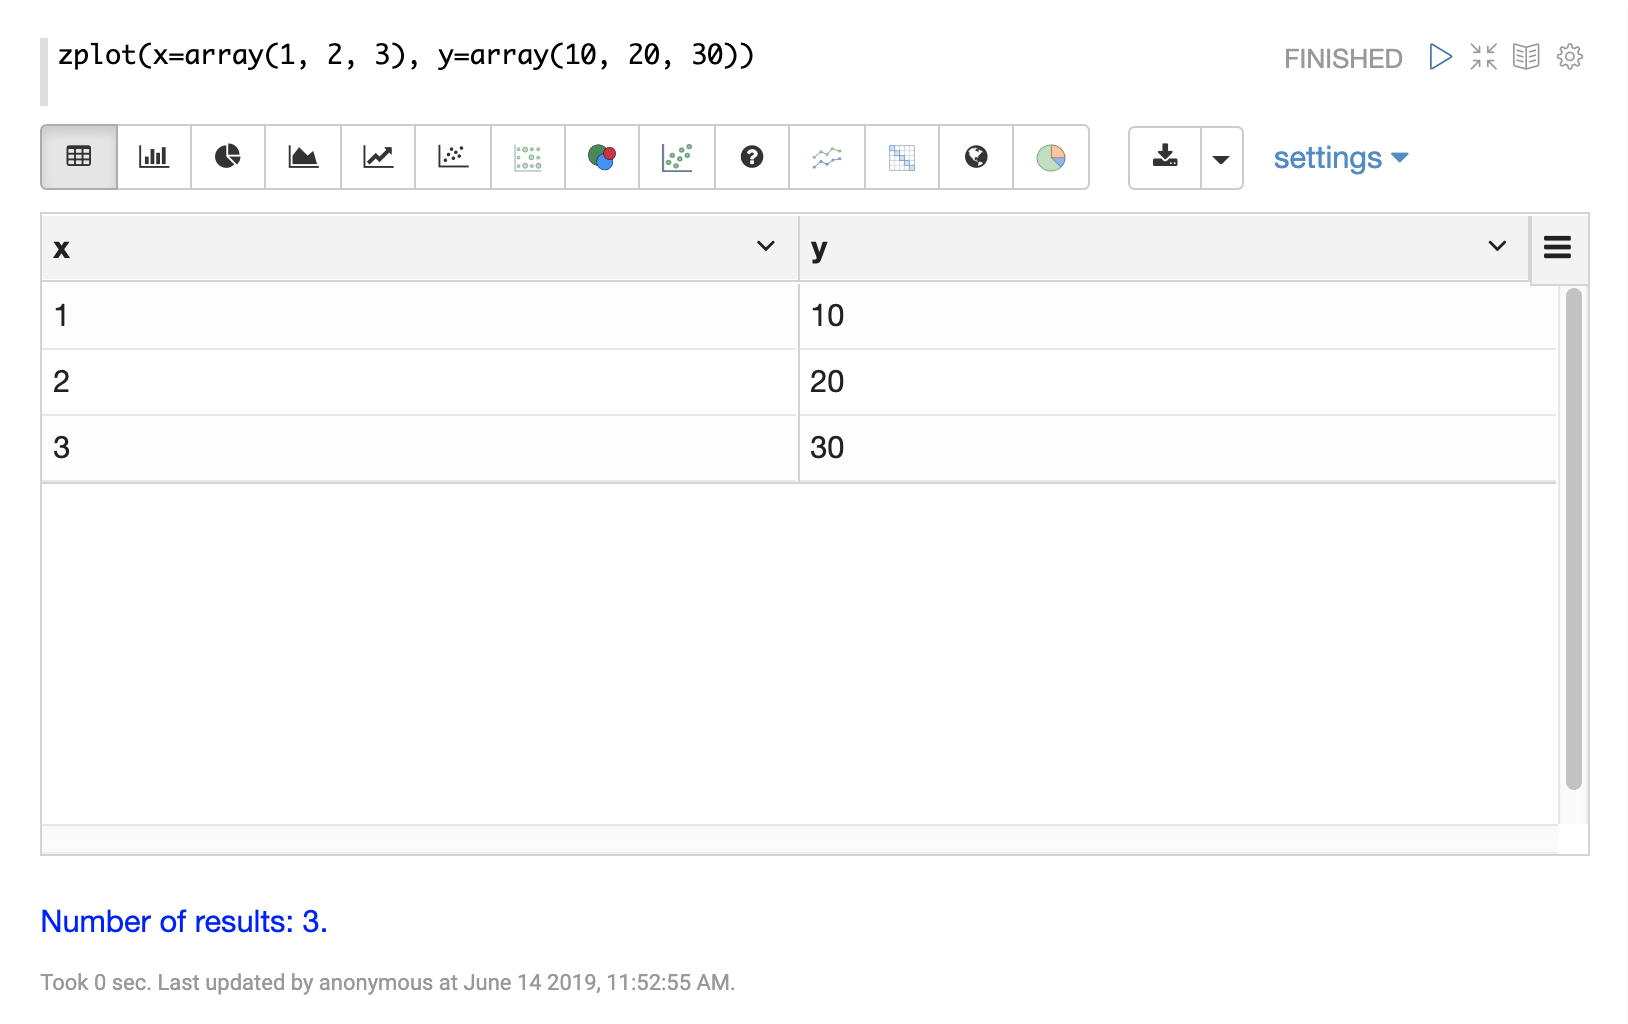
Now we have three tuples with x and y fields.
Let’s see how Zeppelin-Solr handles this output in table format:
Now that we have x and y columns defined we can simply switch to one of the line charts
and plugin the fields to plot using the chart settings:
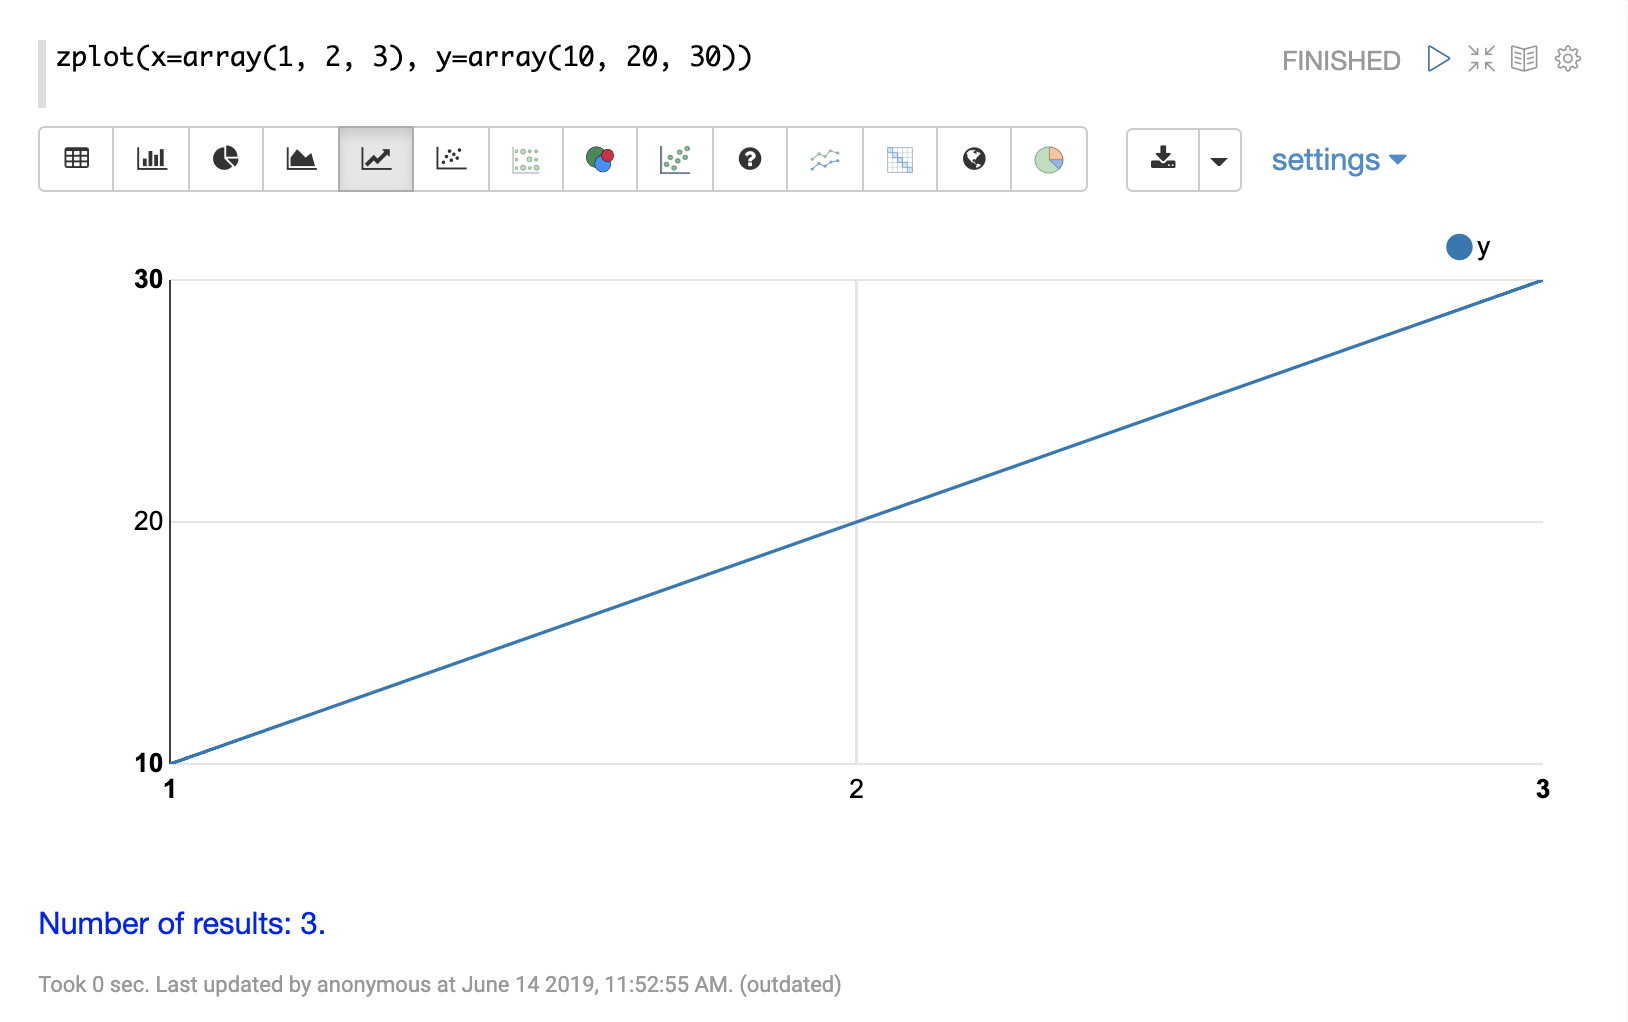
Each chart has settings which can be explored by clicking on settings.
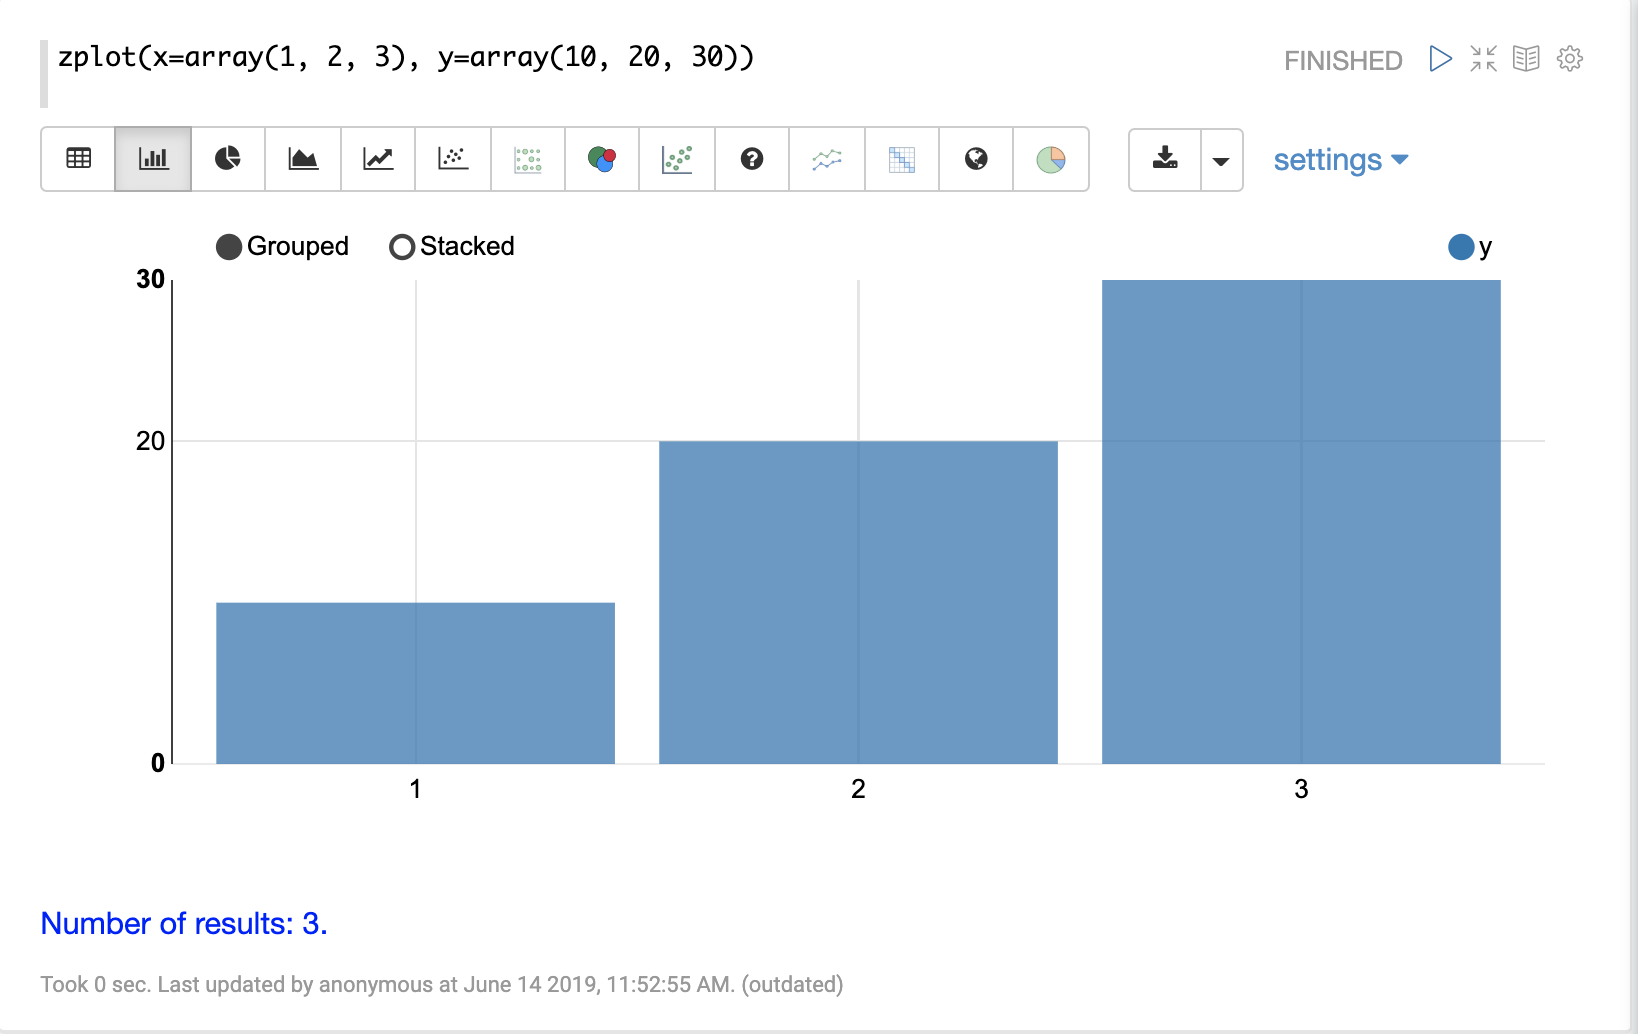
You can switch between chart types for different types of visualizations. Below is an example of a bar chart:
Array Operations
Arrays can be passed as parameters to functions that operate on arrays.
For example, an array can be reversed with the rev function:
rev(array(1, 2, 3))
When this expression is sent to the /stream handler it responds with:
{
  "result-set": {
    "docs": [
      {
        "return-value": [
          3,
          2,
          1
        ]
      },
      {
        "EOF": true,
        "RESPONSE_TIME": 0
      }
    ]
  }
}
Another example is the length function, which returns the length of an array:
length(array(1, 2, 3))
When this expression is sent to the /stream handler it responds with:
{
  "result-set": {
    "docs": [
      {
        "return-value": 3
      },
      {
        "EOF": true,
        "RESPONSE_TIME": 0
      }
    ]
  }
}
A slice of an array can be taken with the copyOfRange function, which
copies elements of an array from a start and end range.
copyOfRange(array(1,2,3,4,5,6), 1, 4)
When this expression is sent to the /stream handler it responds with:
{
  "result-set": {
    "docs": [
      {
        "return-value": [
          2,
          3,
          4
        ]
      },
      {
        "EOF": true,
        "RESPONSE_TIME": 0
      }
    ]
  }
}
Elements of an array can be trimmed using the ltrim (left trim) and rtrim (right trim) functions.
The ltrim and rtrim functions remove a specific number of elements from the left or right of an array.
The example below shows the lrtim function trimming the first 2 elements of an array:
ltrim(array(0,1,2,3,4,5,6), 2)
When this expression is sent to the /stream handler it responds with:
{
  "result-set": {
    "docs": [
      {
        "return-value": [
          2,
          3,
          4,
          5,
          6,
        ]
      },
      {
        "EOF": true,
        "RESPONSE_TIME": 1
      }
    ]
  }
}
Getting Values By Index
Values from a vector can be retrieved by index with the valueAt function.
valueAt(array(0,1,2,3,4,5,6), 2)
When this expression is sent to the /stream handler it responds with:
{
  "result-set": {
    "docs": [
      {
        "return-value": 2
      },
      {
        "EOF": true,
        "RESPONSE_TIME": 0
      }
    ]
  }
}
Sequences
The sequence function can be used to generate a sequence of numbers as an array.
The example below returns a sequence of 10 numbers, starting from 0, with a stride of 2.
sequence(10, 0, 2)
When this expression is sent to the /stream handler it responds with:
{
  "result-set": {
    "docs": [
      {
        "return-value": [
          0,
          2,
          4,
          6,
          8,
          10,
          12,
          14,
          16,
          18
        ]
      },
      {
        "EOF": true,
        "RESPONSE_TIME": 7
      }
    ]
  }
}
The natural function can be used to create a sequence of natural numbers starting from zero.
Natural numbers are positive integers.
The example below creates a sequence starting at zero with all natural numbers up to, but not including 10.
natural(10)
When this expression is sent to the /stream handler it responds with:
{
  "result-set": {
    "docs": [
      {
        "return-value": [
          0,
          1,
          2,
          3,
          4,
          5,
          6,
          7,
          8,
          9
        ]
      },
      {
        "EOF": true,
        "RESPONSE_TIME": 0
      }
    ]
  }
}
Vector Sorting
An array can be sorted in natural ascending order with the asc function.
The example below shows the asc function sorting an array:
asc(array(10,1,2,3,4,5,6))
When this expression is sent to the /stream handler it responds with:
{
  "result-set": {
    "docs": [
      {
        "return-value": [
          1,
          2,
          3,
          4,
          5,
          6,
          10
        ]
      },
      {
        "EOF": true,
        "RESPONSE_TIME": 1
      }
    ]
  }
}
Vector Summarizations and Norms
There are a set of functions that perform summarizations and return norms of arrays. These functions
operate over an array and return a single value. The following vector summarizations and norm functions are available:
mult, add, sumSq, mean, l1norm, l2norm, linfnorm.
The example below shows the mult function, which multiples all the values of an array.
mult(array(2,4,8))
When this expression is sent to the /stream handler it responds with:
{
  "result-set": {
    "docs": [
      {
        "return-value": 64
      },
      {
        "EOF": true,
        "RESPONSE_TIME": 0
      }
    ]
  }
}
The vector norm functions provide different formulas for calculating vector magnitude.
The example below calculates the l2norm of an array.
l2norm(array(2,4,8))
When this expression is sent to the /stream handler it responds with:
{
  "result-set": {
    "docs": [
      {
        "return-value": 9.16515138991168
      },
      {
        "EOF": true,
        "RESPONSE_TIME": 0
      }
    ]
  }
}
Scalar Vector Math
Scalar vector math functions add, subtract, multiply, or divide a scalar value with every value in a vector.
The following functions perform these operations: scalarAdd, scalarSubtract, scalarMultiply,
and scalarDivide.
Below is an example of the scalarMultiply function, which multiplies the scalar value 3 with
every value of an array.
scalarMultiply(3, array(1,2,3))
When this expression is sent to the /stream handler it responds with:
{
  "result-set": {
    "docs": [
      {
        "return-value": [
          3,
          6,
          9
        ]
      },
      {
        "EOF": true,
        "RESPONSE_TIME": 0
      }
    ]
  }
}
Element-By-Element Vector Math
Two vectors can be added, subtracted, multiplied and divided using element-by-element
vector math functions. The available element-by-element vector math functions are:
ebeAdd, ebeSubtract, ebeMultiply, ebeDivide.
The expression below performs the element-by-element subtraction of two arrays.
ebeSubtract(array(10, 15, 20), array(1,2,3))
When this expression is sent to the /stream handler it responds with:
{
  "result-set": {
    "docs": [
      {
        "return-value": [
          9,
          13,
          17
        ]
      },
      {
        "EOF": true,
        "RESPONSE_TIME": 5
      }
    ]
  }
}
Dot Product and Cosine Similarity
The dotProduct and cosineSimilarity functions are often used as similarity measures between two
sparse vectors. The dotProduct is a measure of both angle and magnitude while cosineSimilarity
is a measure only of angle.
Below is an example of the dotProduct function:
dotProduct(array(2,3,0,0,0,1), array(2,0,1,0,0,3))
When this expression is sent to the /stream handler it responds with:
{
  "result-set": {
    "docs": [
      {
        "return-value": 7
      },
      {
        "EOF": true,
        "RESPONSE_TIME": 15
      }
    ]
  }
}
Below is an example of the cosineSimilarity function:
cosineSimilarity(array(2,3,0,0,0,1), array(2,0,1,0,0,3))
When this expression is sent to the /stream handler it responds with:
{
  "result-set": {
    "docs": [
      {
        "return-value": 0.5
      },
      {
        "EOF": true,
        "RESPONSE_TIME": 7
      }
    ]
  }
}