Distributed Solr Tracing
Solr includes a general tracing framework based on OpenTracing that can be used to trace lifecycle of a request for performance monitoring.
Tracing data can be configured to send to arbitrary backend like Jaeger, Zipkin, Datadog, etc. At the moment, only Jaeger is supported out of the box.
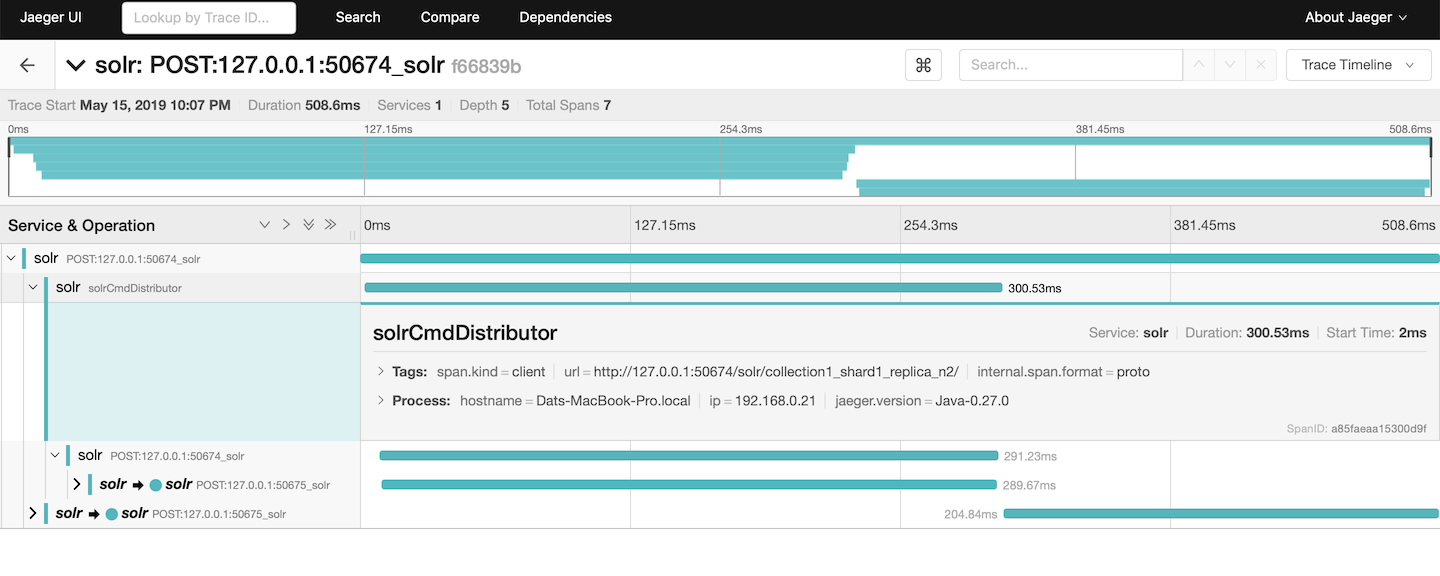
A sampled distributed tracing query request on Jaeger looks like this:
Configuring Tracer
TracerConfigurator is a class used to provide an instance of io.opentracing.Tracer based on configuration in solr.xml.
The JaegerTracerConfigurator provides a JaegerTracer instance to a Solr node.
A setup of a TracerConfigurator in solr.xml looks like this:
<solr>
  <tracerConfig name="tracerConfig" class="org.apache.solr.jaeger.JaegerTracerConfigurator">
    <str name="agentHost">localhost</str>
    <int name="agentPort">5775</int>
    <bool name="logSpans">true</bool>
    <int name="flushInterval">1000</int>
    <int name="maxQueueSize">10000</int>
  </tracerConfig>
</solr>
If <tracerConfig> is absent, TracerConfigurator will try to pick up the Tracer instance that was registered in io.opentracing.util.GlobalTracer.
By doing this some backends like DataDog are supported out of the box since
datadog-java-agent uses Javaagent to register a Tracer in
io.opentracing.util.GlobalTracer.
Configuring Sample Rate
By default only 0.1% of requests are sampled, this ensures that tracing activities do not affect performance of a node.
The rate can be changed without needing to restart Solr nodes by setting the new sample rate as a cluster property using the Collections API’s CLUSTERPROP command.
For example, the following sets the samplePercentage property to 100%:
/admin/collections?action=CLUSTERPROP&name=samplePercentage&val=100
Jaeger Tracer Configurator
The contrib/jagertracer-configurator provides a default implementation for setting up Jaeger Tracer.
Note that all libraries of jaegertracer-configurator must be included in the classpath of all nodes.
Then Jaeger tracer can be set up in solr.xml like this:
<tracerConfig name="tracerConfig" class="org.apache.solr.jaeger.JaegerTracerConfigurator">
  <str name="agentHost">localhost</str>
  <int name="agentPort">5775</int>
  <bool name="logSpans">true</bool>
  <int name="flushInterval">1000</int>
  <int name="maxQueueSize">10000</int>
</tracerConfig>
The parameters for JaegerTracerConfigurator include:
agentHostRequired Default: none The Jaeger backend host.
agentPortRequired Default: none The Jaeger port.
logSpansOptional Default: trueWhether the tracer should also log the spans.
flushIntervalOptional Default: 5000(ms)The tracer’s flush interval.
maxQueueSizeOptional Default: 10000The tracer’s maximum queue size.
Other parameters which are not listed above can be configured using system properties or environment variables. The full list of parameters can be found in the Jaeger-README.