The Thread Dump screen lets you inspect the currently active threads on your server.
Each thread is listed and access to the stacktraces is available where applicable. Icons to the left indicate the state of the thread: for example, threads with a green check-mark in a green circle are in a "RUNNABLE" state. On the right of the thread name, a down-arrow means you can expand to see the stacktrace for that thread.
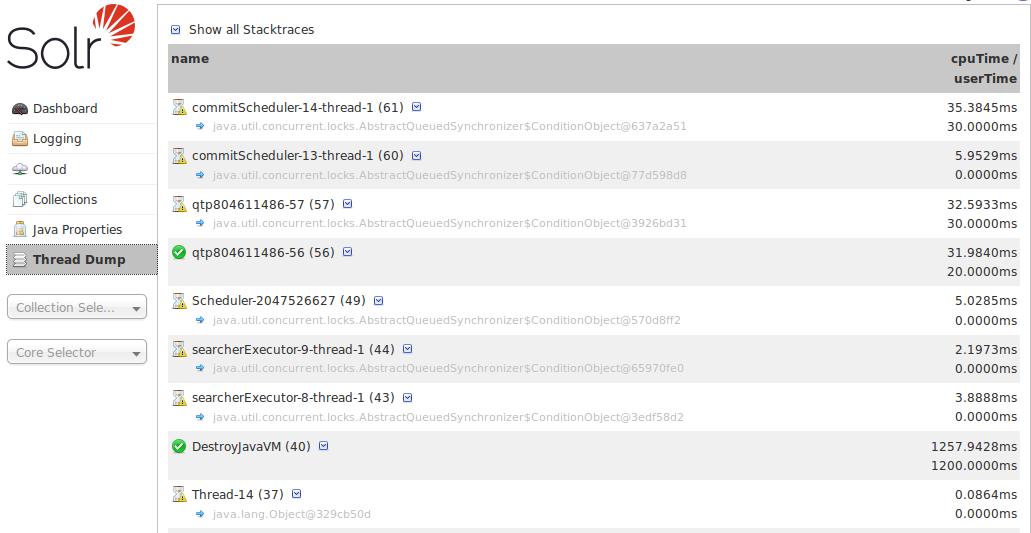
When you move your cursor over a thread name, a box floats over the name with the state for that thread. Thread states can be:
| State | Meaning |
|---|---|
NEW |
A thread that has not yet started. |
RUNNABLE |
A thread executing in the Java virtual machine. |
BLOCKED |
A thread that is blocked waiting for a monitor lock. |
WAITING |
A thread that is waiting indefinitely for another thread to perform a particular action. |
TIMED_WAITING |
A thread that is waiting for another thread to perform an action for up to a specified waiting time. |
TERMINATED |
A thread that has exited. |
When you click on one of the threads that can be expanded, you’ll see the stacktrace, as in the example below:
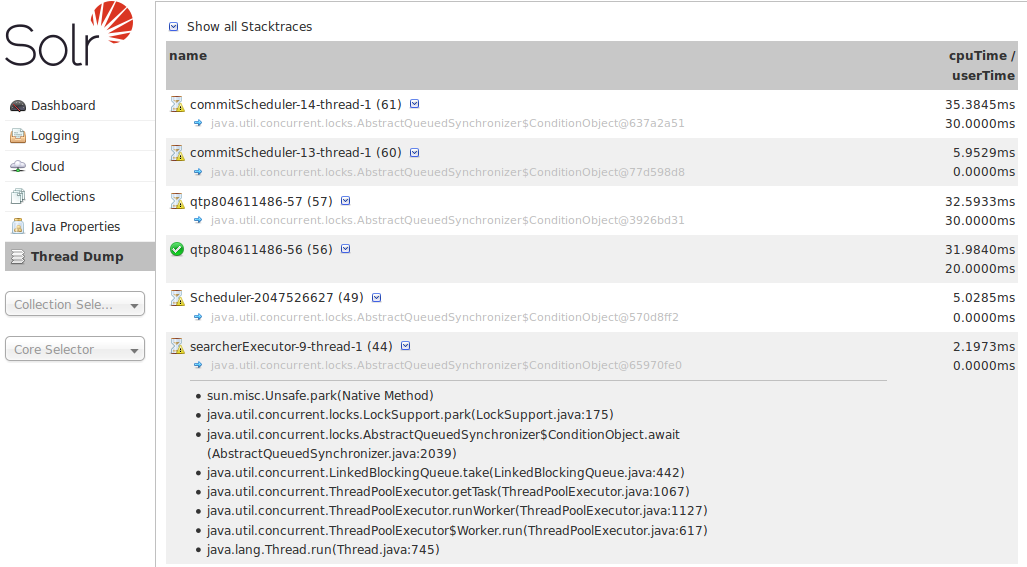
You can also check the Show all Stacktraces button to automatically enable expansion for all threads.